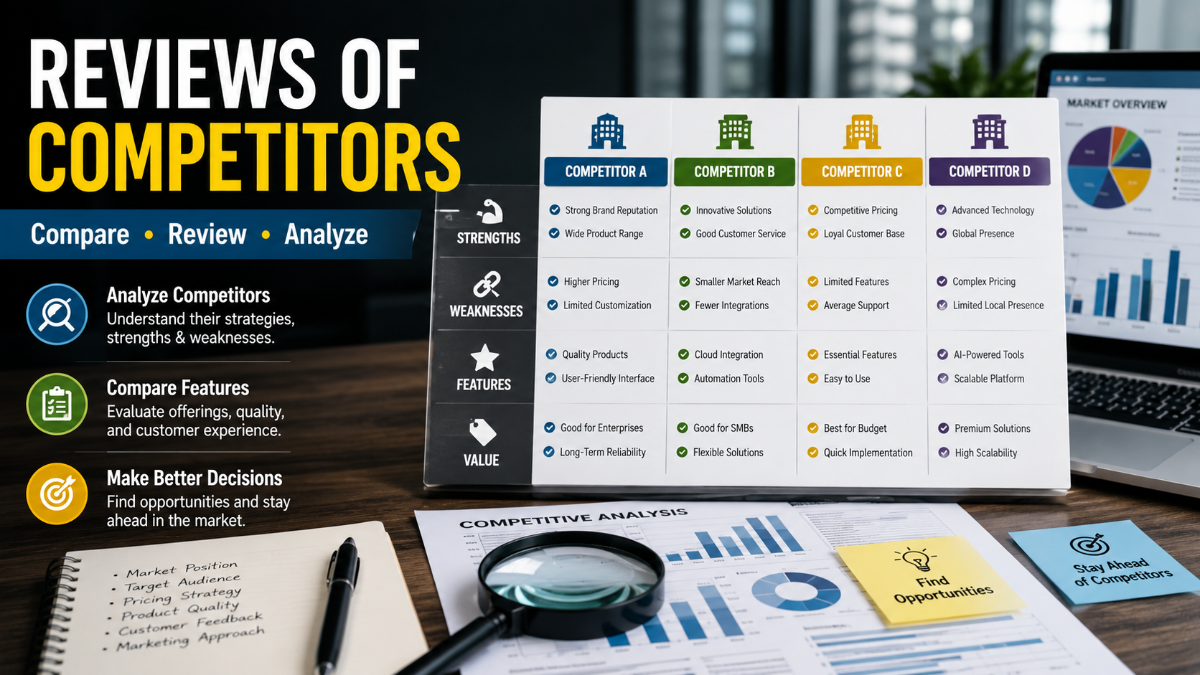
Competitor review analysis turns customer feedback about rival businesses into structured competitive intelligence. When researching reviews of competitors, the objective is not simply to collect star ratings: it is to compare feedback consistently, identify patterns, validate them against other evidence, and make better product, marketing, sales, and customer-experience decisions.
Use this workflow: Collect → Flag → Segment → Code → Count → Normalize → Compare → Prioritize → Validate → Act → Monitor. Public reviews offer useful customer-perspective evidence, but voluntary reviews may overrepresent unusually positive or negative experiences, so they should not be treated as a complete view of every customer.
Step 1: Collect Relevant Competitor Reviews
Start with the decision your research must support. You may be investigating a product gap, refining competitive positioning, preparing sales enablement, assessing customer experience, or testing a pricing hypothesis.
Select direct competitors first, then choose sources that are relevant to the product category, target market, geography, and buyer type. No platform is universally best: a source that captures local service experiences may not be comparable with one used primarily for B2B software evaluation.
Record the source, date, rating, and product context for every review. If possible, collect reviews from more than one relevant source, but keep each platform separate during initial analysis.
There is no universal review-count threshold. For practical qualitative analysis, begin with enough detailed reviews to identify recurring themes, then check whether those themes remain stable as you add more feedback, examine another segment, or analyze a different time period.
Step 2: Flag Data Quality Issues
Do not automatically remove reviews because they are unverified, highly positive, highly negative, or inconvenient. Instead, flag uncertainty so you can evaluate whether it changes the overall result.
Useful flags include:
- Duplicate or near-duplicate wording
- Unusual review bursts within a short period
- Repeated reviewer profiles
- Promotional or scripted language
- Platform authenticity warnings
- Potential conflicts with a platform’s review rules
- Verified-purchase or transaction-linked status, where available
- Unclear customer context or uncertain authenticity
Flagging is not proof that a review is fake. It is a method for documenting uncertainty and testing whether findings remain consistent with or without flagged records. A purchase-verification label can add context, but it does not establish that a review is representative, unbiased, or useful for every analytical purpose.
Read More: Purple flowers
Step 3: Build a Review Coding System
Create a codebook before reading the full dataset. Defined categories make it easier to compare competitors and reduce the risk that different analysts classify the same issue inconsistently.
| Field | What to record |
| Competitor | Business, product, or service being reviewed |
| Source | Platform, marketplace, directory, or forum |
| Date | Review publication date |
| Rating | Star rating or equivalent score |
| Customer segment | Company size, use case, location, plan, or buyer type where visible |
| Product context | Product line, feature, version, or service type |
| Sentiment | Positive, negative, neutral, or mixed |
| Primary theme | Main benefit, complaint, or issue |
| Secondary themes | Other relevant themes mentioned |
| Switching trigger | Reason for adopting, leaving, renewing, or comparing providers |
| Response quality | Whether and how the business responded |
| Quality flags | Duplicate, uncertain, verified where available, or another documented concern |
Typical themes include pricing, value, onboarding, usability, customer support, reliability, billing, delivery, quality, integrations, reporting, and missing features.
If multiple people code the data, have them independently code the same small subset before analyzing the full dataset. Compare results, resolve unclear definitions, and update the codebook. Checking agreement between coders is a recognized way to assess consistency in structured qualitative analysis.
Step 4: Count Reviews and Theme Mentions
One review can contain several issues. A customer may mention confusing onboarding, slow support, and unclear billing in the same review.
Use two separate measures:
| Measure | Formula | What it shows |
| Review-level theme frequency | Reviews mentioning a theme ÷ total reviews analyzed × 100 | How many reviews mention an issue |
| Theme-mention share | Theme mentions ÷ total coded theme mentions × 100 | How prominent an issue is among all coded mentions |
For example:
Onboarding frequency = 30 reviews mentioning onboarding ÷ 150 reviews analyzed × 100 = 20%.
A review counts once in the review-level denominator even if it includes several themes. In a mention-level analysis, the same review may contribute to several theme counts. State the denominator in every table so readers do not confuse review frequency with issue share.
Step 5: Normalize Competitor Review Data
Raw review counts are rarely comparable on their own. Twenty onboarding complaints among 100 analyzed reviews mean something different from twenty complaints among 5,000.
Make the data more comparable by using:
- The same date range where practical
- The same inclusion criteria for language, geography, review type, and product category
- The same theme definitions across competitors
- Raw counts alongside percentages
- Separate reporting for primary themes and secondary themes
- Customer, product, plan, and geography segmentation where available
- Consistent quality-flag rules
Analyze each review source separately first. Use cross-platform comparisons only when the customer populations, time periods, review criteria, and product contexts are sufficiently aligned.
For example, local-service reviews may primarily reflect in-person experiences, while structured B2B product reviews may focus on implementation, product use, and support. Do not combine both sources into a single percentage solely because both contain customer feedback.
Step 6: Analyze Rating Distribution and Review Velocity
Average ratings can hide important differences. Two competitors can both average 4.2 stars while having very different distributions of customer experiences.
| Rating | Competitor A | Competitor B | Competitor C |
| 1 star | |||
| 2 stars | |||
| 3 stars | |||
| 4 stars | |||
| 5 stars |
A competitor with many one-star and five-star reviews may have a more polarized experience than one with mostly four-star ratings, even when their averages are similar.
Review velocity is the rate at which new reviews are published during a defined period.
Review velocity = New reviews ÷ Time period
For example: 120 new reviews ÷ 6 months = 20 reviews per month.
Review velocity can provide context about recent customer activity, but it is not a direct measure of sales growth, market share, or customer satisfaction.
Step 7: Find Competitor-Specific Gaps
A recurring complaint is not automatically a unique weakness. Compare the same theme across the competitors in your analysis.
| Onboarding complaint frequency | Competitor A | Competitor B | Competitor C | Interpretation |
| Similar pattern | 18% | 17% | 16% | Likely category-wide friction |
| Concentrated pattern | 22% | 5% | 4% | Stronger evidence of a Competitor A-specific issue |
Do not treat small percentage differences as meaningful automatically. Check the underlying review counts and see whether the pattern persists across more reviews, customer segments, sources, and time periods.
If a complaint appears across the category, it may still reveal a market opportunity: solve the problem more effectively than alternatives. If it is concentrated in one competitor, it may support targeted research, positioning, or sales enablement.
Step 8: Build a Competitor Scorecard
Copy this scorecard into your working spreadsheet and populate it with the coded dataset.
| Metric or theme | Competitor A | Competitor B | Competitor C | Your business |
| Reviews analyzed / date range | ||||
| Sources analyzed | ||||
| Rating distribution | ||||
| Review velocity | ||||
| Most praised outcome | ||||
| Price or value complaints | ||||
| Onboarding or usability complaints | ||||
| Support complaints | ||||
| Reliability or quality complaints | ||||
| Missing-feature complaints | ||||
| Main switching trigger | ||||
| Response quality | ||||
| Biggest recurring weakness |
For public responses to reviews, assess more than speed. Consider response rate, acknowledgement of the issue, specificity, proposed resolution, follow-up where visible, and whether the same complaint continues to appear later.
Step 9: Prioritize Gaps With an Opportunity Score
Use a simple 1–5 scoring model to decide which findings deserve further investment. It is a prioritization aid, not a statistically validated universal formula.
| Gap | Frequency | Severity | Strategic fit | Differentiation potential | Total |
| Onboarding friction | 5 | 4 | 5 | 5 | 19 |
| Reporting limitations | 3 | 4 | 4 | 4 | 15 |
| Minor interface issue | 4 | 1 | 3 | 2 | 10 |
Opportunity score = Frequency + Severity + Strategic fit + Differentiation potential
Use consistent scoring anchors:
| Factor | Score of 1 | Score of 3 | Score of 5 |
| Frequency | Rare in the defined dataset | Recurs periodically | Repeated and persistent |
| Severity | Minor inconvenience | Meaningful friction | Likely to block adoption, cause churn, or trigger switching |
| Strategic fit | Outside current capabilities | Partially aligned | Directly aligned with strategy and capabilities |
| Differentiation potential | Common market issue | Moderate advantage possible | Clear, defensible advantage |
A high-frequency complaint is not automatically the best opportunity. A less common issue that blocks adoption or drives customer switching may be more valuable than a widely reported but minor annoyance.
Step 10: Validate Findings Before Acting
Competitor review analysis should produce hypotheses, not final conclusions. Validate high-priority findings against evidence that measures related customer behavior.
| Evidence source | What it can clarify |
| Competitor reviews | Public customer perceptions and reported experiences |
| Support tickets | Problems affecting existing customers |
| Win/loss interviews | Buying, switching, and rejection reasons |
| Sales calls | Current objections and buyer language |
| Product analytics | Actual usage behavior and feature adoption |
| Customer interviews | Deeper motivations and unmet needs |
| Market research | Category expectations and segment differences |
| Finding | Review evidence | Supporting evidence | Confidence |
| Onboarding friction | Frequent recent complaints | Support tickets show setup problems | High |
| Price concern | Repeated value complaints | Win/loss interviews mention price | Medium-high |
| Missing feature | Feature-gap mentions | Sales calls repeatedly request it | High |
| Reliability concern | Some negative mentions | No corroborating evidence | Low-medium |
When evidence conflicts, do not assume the largest dataset is automatically the most reliable. Consider relevance, recency, sampling bias, customer segment, and whether the evidence measures the same underlying behavior.
Step 11: Act and Monitor Changes
Translate validated findings into a specific business action:
- Improve a product workflow or service process
- Create sales enablement around a verified differentiator
- Adjust positioning to address a documented unmet expectation
- Build content that answers recurring buyer questions
- Investigate pricing, packaging, support, or onboarding gaps
- Monitor a competitor’s response to an identified weakness
Revisit the analysis after meaningful changes, including:
- Major product releases
- Pricing or packaging changes
- Acquisitions or mergers
- Service-policy changes
- Significant negative events
- Sudden rating changes
- Unusual spikes in review volume
- Major competitor campaigns or market shifts
Worked Example
The following example uses fictional data.
A SaaS company analyzes recent, comparable reviews of three competitors. Onboarding is mentioned in 28% of Competitor A’s negative-review records, compared with 7% for Competitor B and 9% for Competitor C.
- Observation: Onboarding is the leading negative theme for Competitor A.
- Comparison: The issue appears less frequently in comparable datasets for B and C.
- Validation: Sales-call notes and prospects’ migration comments also mention setup complexity.
- Priority score: Frequency 5, severity 4, strategic fit 5, differentiation potential 5 = 19.
- Action: Improve guided setup and reduce time-to-first-value, the time between starting a product and achieving a meaningful outcome.
- Positioning: Promote guided implementation only when product capabilities and customer evidence support the claim.
The appropriate conclusion is not that Competitor A has “bad onboarding.” It is that the defined dataset shows comparatively frequent onboarding criticism, supported by independent evidence.
What Review Analysis Cannot Tell You
Competitor feedback analysis is useful, but reviews alone cannot reveal:
- The views of all customers
- A competitor’s internal operational causes
- Whether a complaint has significant commercial impact
- Whether a release directly caused a sentiment change
- Whether review populations across platforms are equivalent
- Whether an individual review represents the wider customer base
Use reviews of competitors to identify and prioritize questions. Validate important conclusions with customer research, product data, sales evidence, and broader competitive intelligence.
Tools for Competitor Review Analysis
| Approach | Best use | Limitation |
| Spreadsheet or database | Small-to-medium datasets | Manual coding can be time-intensive |
| Review-monitoring platform | Tracking new reviews and mentions | May lack thematic depth |
| Sentiment-analysis tool | Initial classification at scale | Can miss nuance and mixed sentiment |
| Theme-extraction workflow | Identifying recurring topics | Needs a clear human-defined taxonomy |
| AI-assisted analysis | Draft coding, clustering, and summaries | Requires human review of important findings |
| Structured review source | Category-specific product research | Coverage varies by market and audience |
Automation can accelerate collection and early analysis, but high-impact patterns should be checked manually before influencing product, sales, or positioning decisions.
Ethical and Legal Considerations
Reading public reviews differs from scraping, storing, republishing, or commercially using review content at scale. Platform terms, data-access rules, privacy obligations, and applicable laws vary by jurisdiction.
Republishing review text may raise copyright, attribution, privacy, publicity-rights, and platform-terms issues. Check the relevant platform’s current rules and seek appropriate permission or legal guidance before automating collection, storing large datasets, or reusing customer review content externally.
Frequently Asked Questions
Can AI analyze competitor reviews?
AI can help classify sentiment, cluster themes, summarize recurring complaints, and identify potential switching triggers. It should not make final strategic decisions on its own because it may misread sarcasm, mixed feedback, industry terminology, or product context. Use AI for first-pass analysis, audit a sample manually, and validate high-priority findings with independent customer or market evidence.
How do I compare competitors with different review volumes?
Preserve raw counts and calculate percentages using each competitor’s total analyzed reviews. Apply comparable date ranges, theme definitions, customer segments, and inclusion rules. If datasets differ substantially by platform, geography, or product type, analyze them separately instead of presenting a single combined comparison.
How do I analyze competitors with very few reviews?
Treat a small dataset as exploratory evidence, not proof of a stable pattern. Supplement it with customer interviews, win/loss research, sales-call notes, product documentation, competitor messaging, and relevant market conversations. Refresh the analysis as new feedback appears rather than making broad claims from limited reviews.
How do I identify switching triggers in customer reviews?
Look for language such as “switched from,” “moved away from,” “cancelled,” “replaced,” “renewed,” or “chose this because.” Code the reason separately from overall sentiment. Common triggers include price increases, missing features, difficult onboarding, weak support, reliability issues, delivery problems, and contract restrictions.
Can competitor review analysis improve SEO and content strategy?
Yes. Customer reviews of competitors can reveal recurring questions, objections, comparison terms, unmet needs, and buyer language. Use these insights to create helpful buyer guides, comparison pages, onboarding resources, feature explainers, and troubleshooting content. Do not copy review text or make unsupported claims about competitors.
Are verified-purchase reviews always more reliable?
No. A verified-purchase label may indicate that a platform connected a review to a transaction, but it does not prove that the feedback is representative, unbiased, accurate, or relevant to every analysis. Treat it as one quality signal alongside recency, detail, customer context, rating distribution, and authenticity flags.
What is the difference between review volume and review velocity?
Review volume is the total number of reviews available at a given time. Review velocity is the rate at which new reviews appear over a defined period, such as reviews per month. Both metrics provide context, but neither proves sales growth, market share, or satisfaction by itself
How can I tell whether a competitor fixed a weakness?
Compare equivalent review periods before and after a known product release, pricing update, policy change, or service change. Track rating distribution, review volume, theme frequency, and customer segments. A lower complaint rate may suggest improvement, but it should be interpreted alongside changes in the customer mix and source activity.
Should I analyze positive competitor reviews as well as negative ones?
Yes. Negative reviews reveal friction and possible churn drivers, while positive reviews reveal customer expectations, valued outcomes, and category table stakes. Analyzing both gives a fuller view of what customers value, what frustrates them, and where your business can credibly differentiate.
What should I do if review evidence conflicts with sales or support data?
Investigate the disagreement rather than automatically trusting one source. Check whether the sources represent different customer segments, time periods, product versions, or stages of the buying journey. Conflicting evidence can reveal that a problem is new, affects only certain customers, or is more visible publicly than internally